Understanding Statistics
Here we explain how statistics work in the Unypan club app.
Custom Statistics
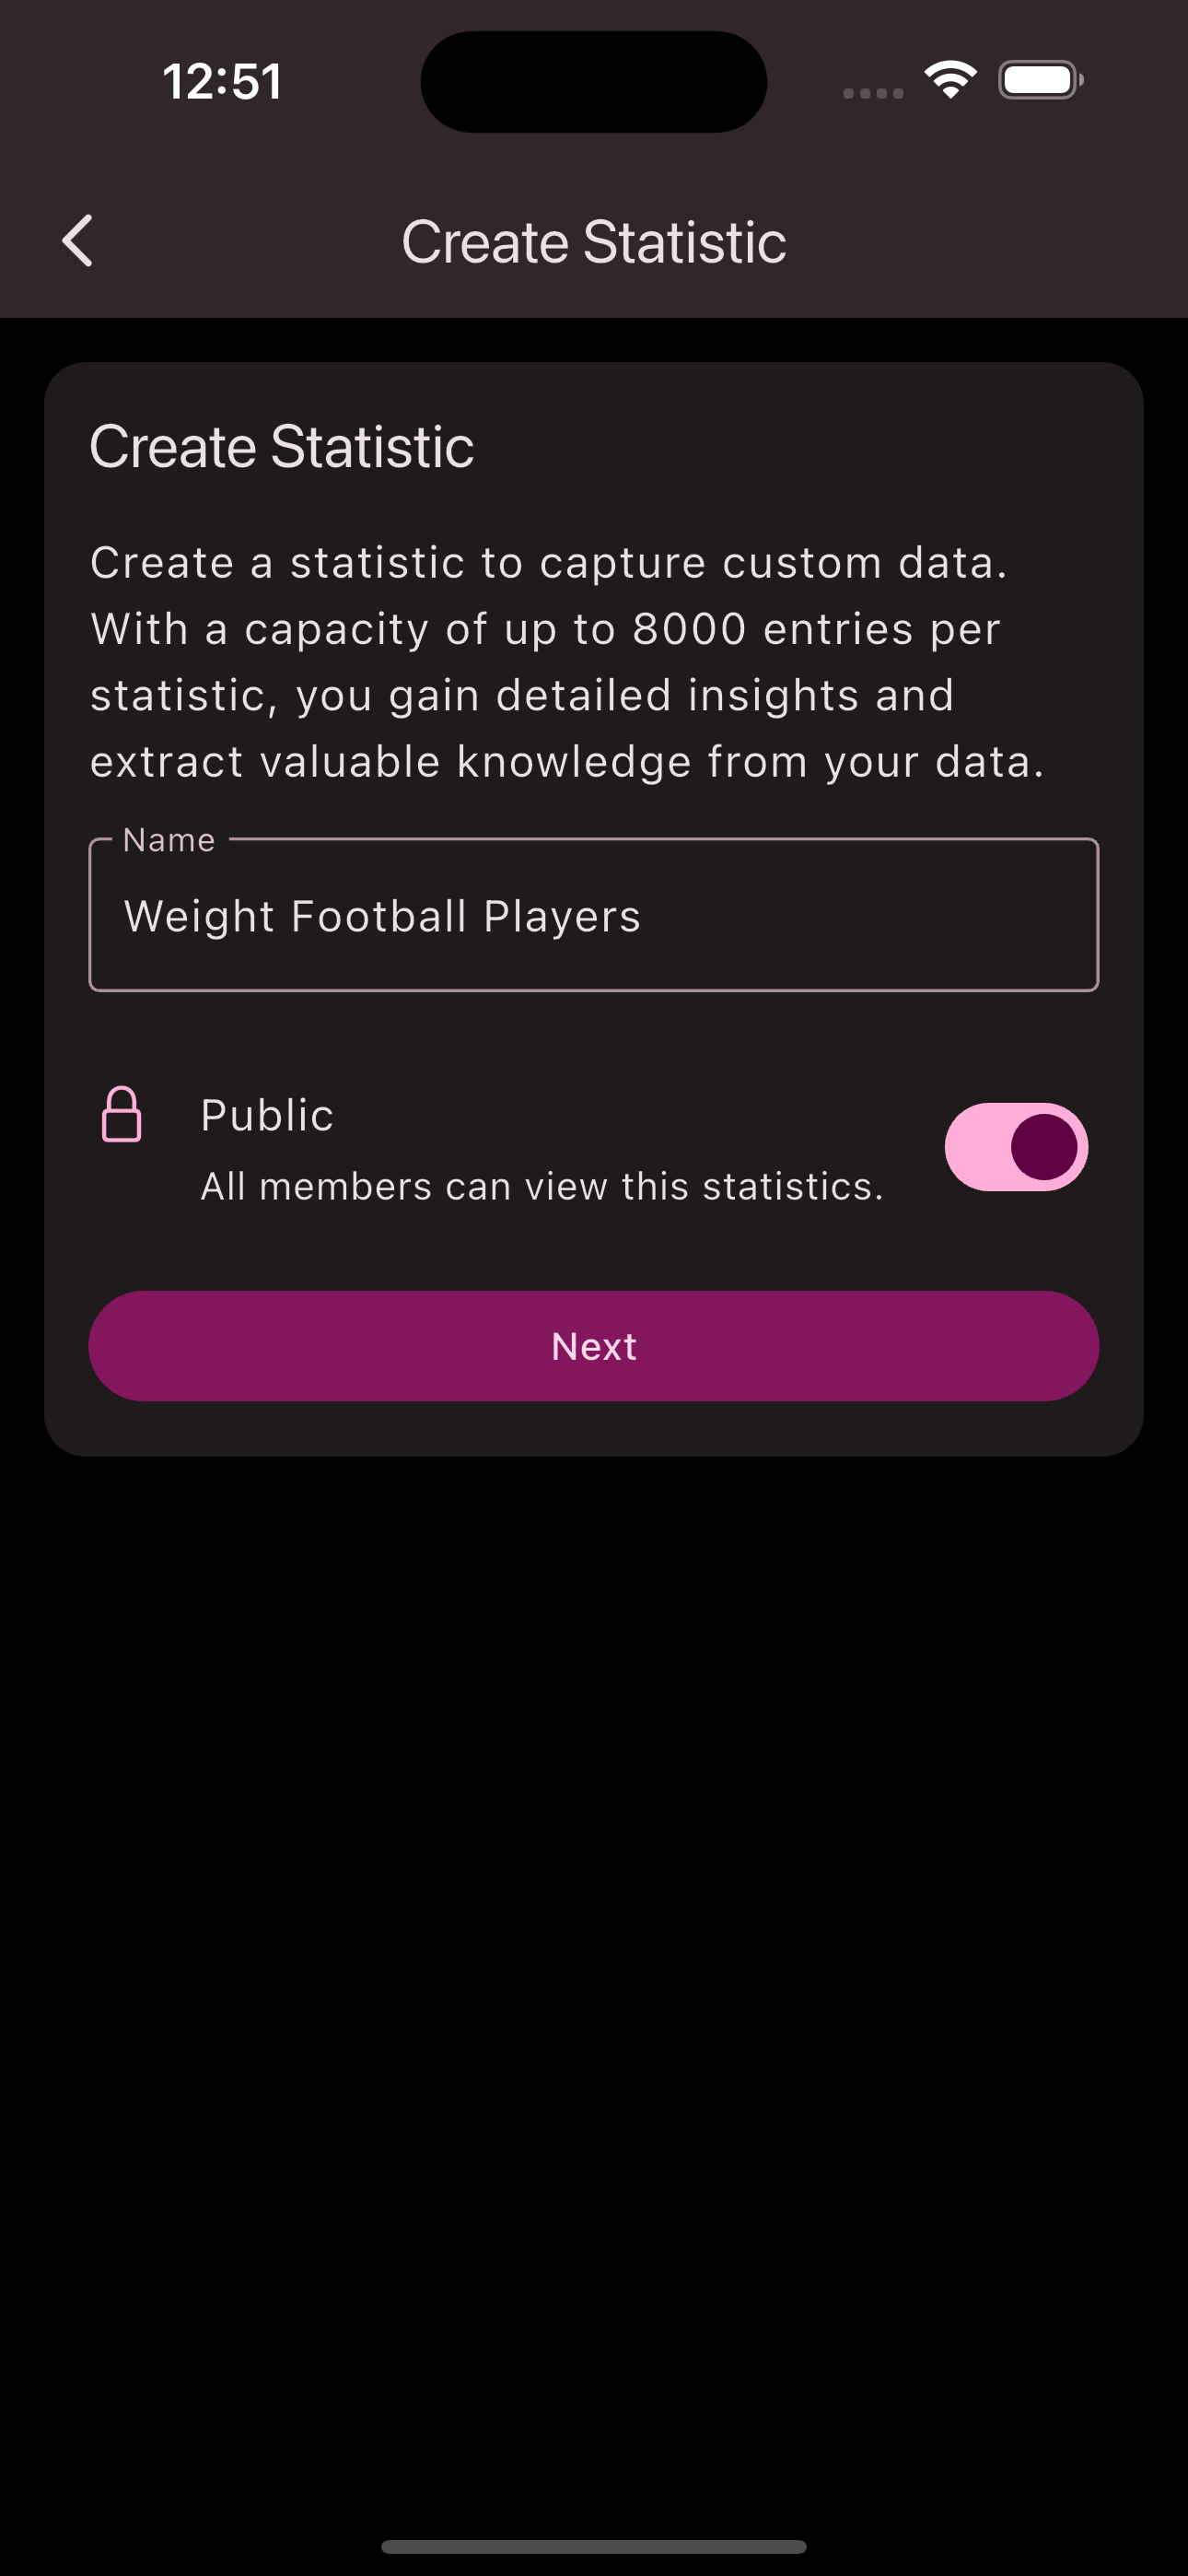
The Unypan club app allows you to create custom statistics. Custom means that you can define which attributes can be recorded in the statistics. A statistic consists of the following attributes: Name, if it is public, Fields, Measurements, and Views.
The name describes what data should be recorded in the statistic.
The public switch determines whether the statistic is publicly visible or not. Publicly visible means that every member in the club can see the statistic and has read access to the recorded data. Statistics that are not public can only be viewed and recorded by members with the following roles: Admin
, Organization Manager
, Group Leader
. 
Fields
The fields define which attributes can be recorded in the statistic. You can define these when creating or editing the statistic. Examples of fields in a statistic that records the weight of members would be: Weight, Date, Member.
Each field has a defined data type that determines what kind of information can be recorded in the field. The supported data types are: Enumeration, Date, Duration, Yes or No, Number, Decimal Number, Text, Member, Single Event. 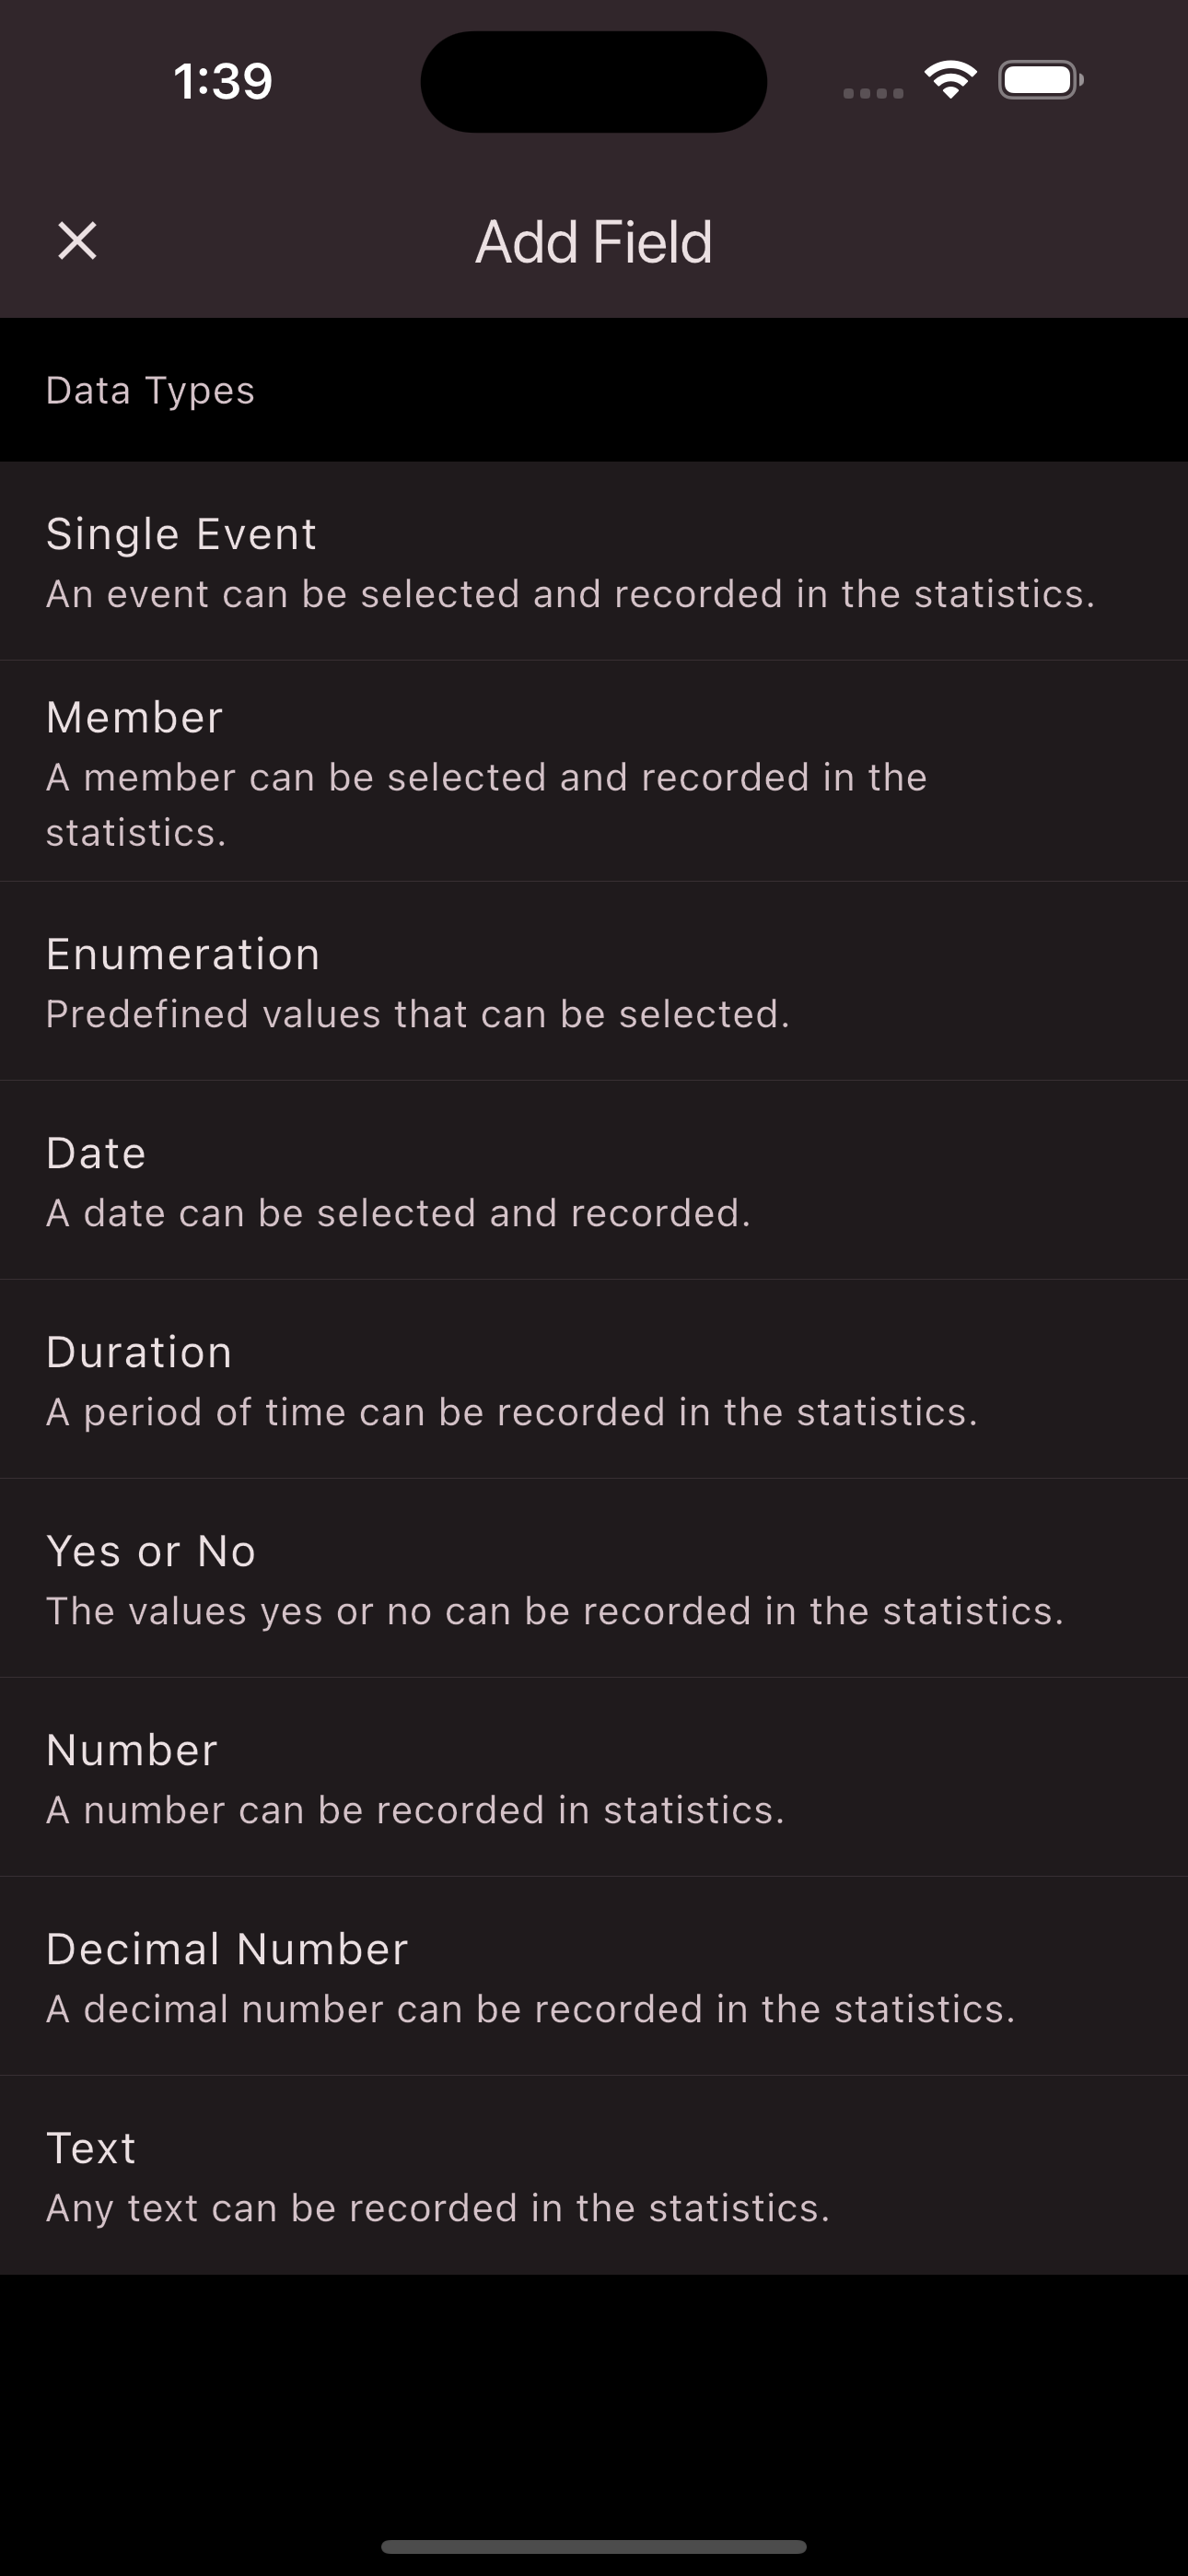
Most data types should be self-explanatory. However, some special data types are Enumeration, Member, and Single Event.
The Enumeration data type allows you to record predefined values that are defined when creating the statistic. An example of this would be a status field in a statistic that records the weight of football players. Here you would define the status field as an enumeration and set the statuses as predefined values such as: Under Target, On Target, and Over Target. 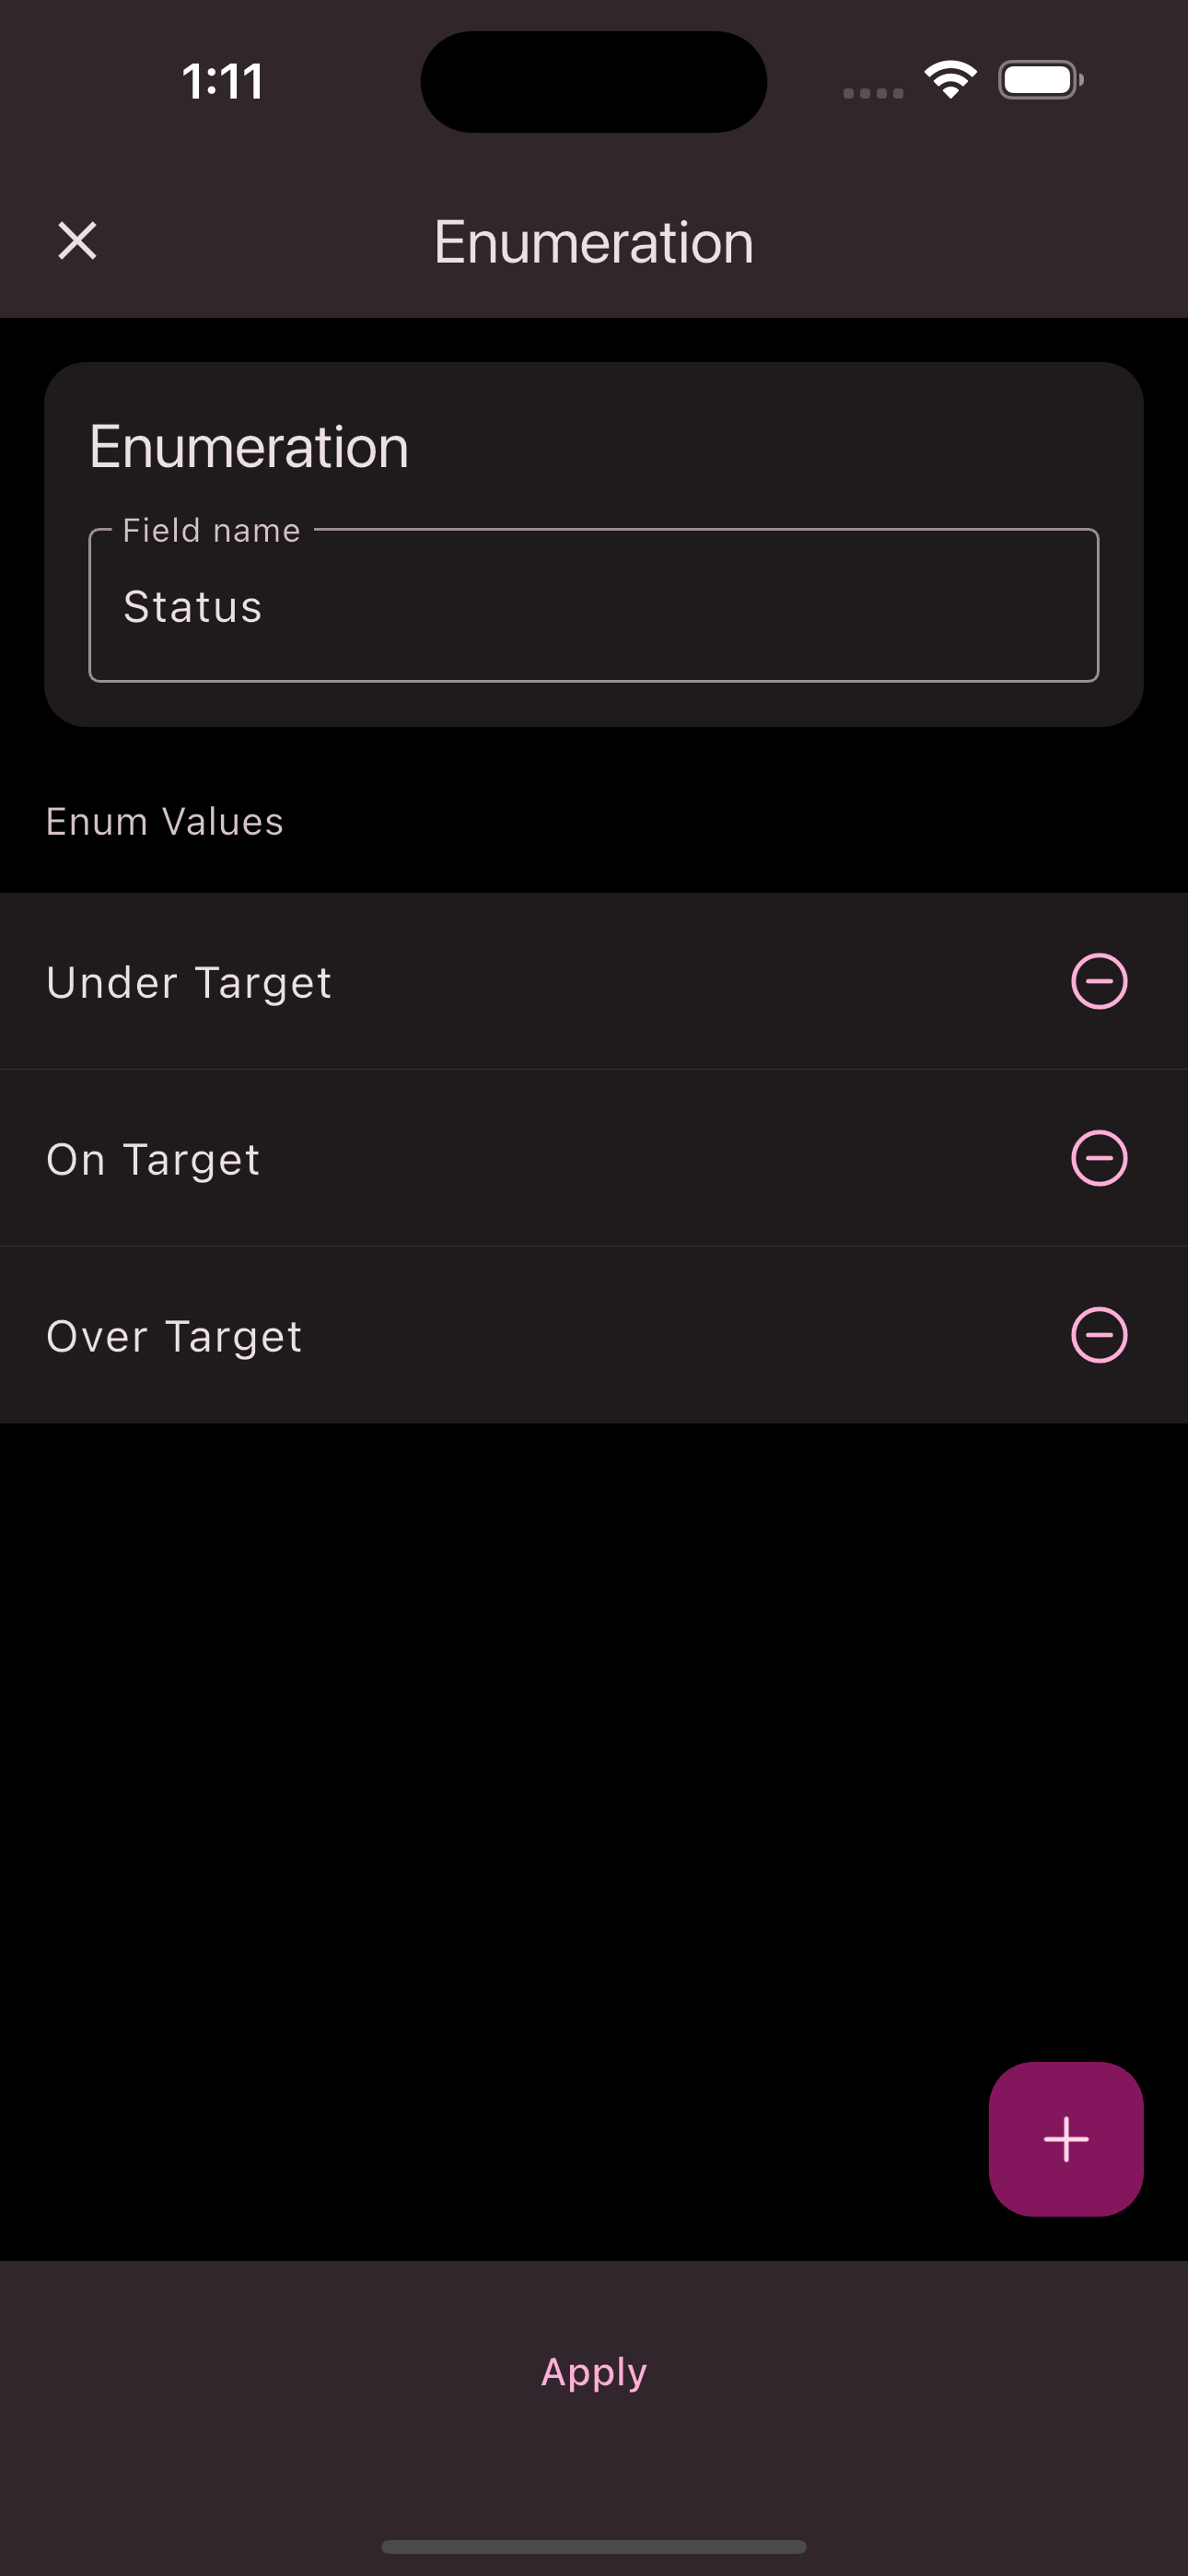
The Member data type allows you to record a member of the club. For example, if a member’s weight is recorded in a statistic, this data type can directly reference the member to whom the recorded weight belongs.
The Single Event data type allows you to record an event in a statistic entry. Let’s consider recording weight as an example statistic. We probably record weight on training days. These training days are events in the Unypan app. Through the Event data type, we can link the weight to the corresponding training event.
Measurements
In addition to fields, a statistic also has measurements that are used to analyze the recorded data. A measurement consists of a function that is applied to a numeric field of the statistic. The available functions are: Sum, Minimum, Maximum, Average. In addition, there is the special function Count. This is not applied to a numeric field, but to the recorded entries of the statistic itself. 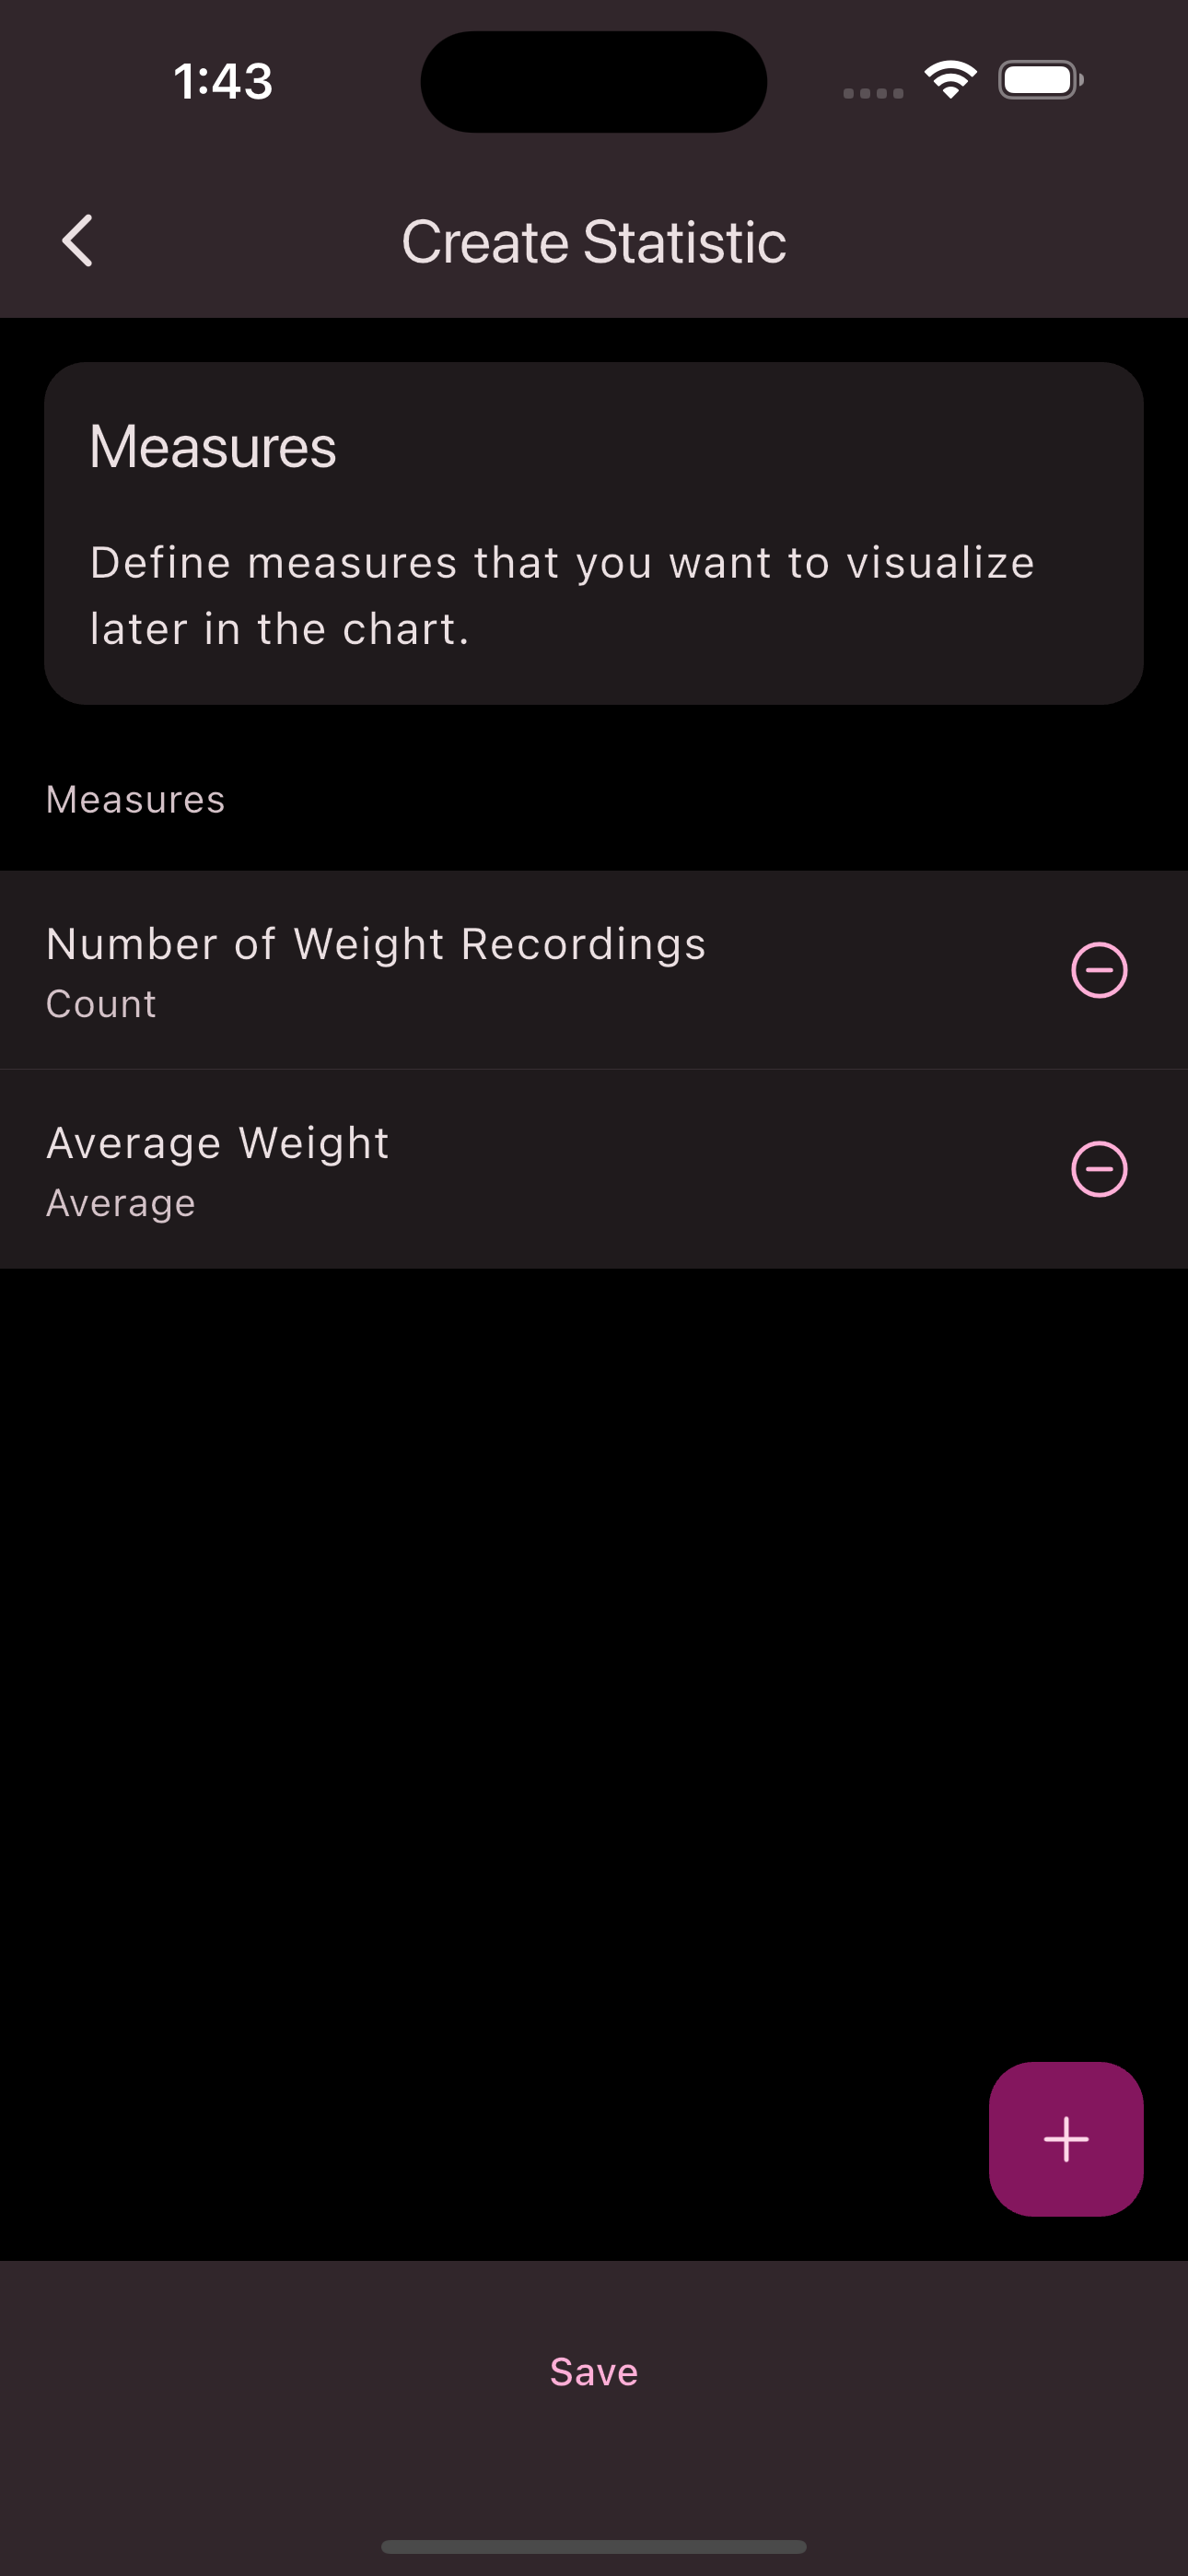
If you are unsure which measurements to define for your statistic, the Count function, which is applied to the entries themselves, is usually the right choice.
An example would look like this. Let’s say you have defined a statistic named Fights. A fight has the fields Fight Duration, Member, and Event. You also defined the measurement Number of Fights
which uses the Count function. You record two entries because two fights have taken place. Applying the measurement Number of Fights
would now show you that two fights have taken place. You can then further refine this analysis by displaying the number of fights per member or per event, for example. Setting the view is controlled via Dimensions and Measurements. More on that later.
An example of an Average function would be if we introduce a measurement to the Weight
field of a Weights statistic with the name Average Weight
. If we now record several entries for a member, we can use this measurement to see their weight on average.
Dimensions
Dimensions are not directly part of a statistic, but they are used to define the view of the statistics. Let’s take the example of the Attendance statistic provided by the Unypan app. Here we want to create a view in which we can see the Attendance data per event. We are interested in how many members were present and how many were absent. 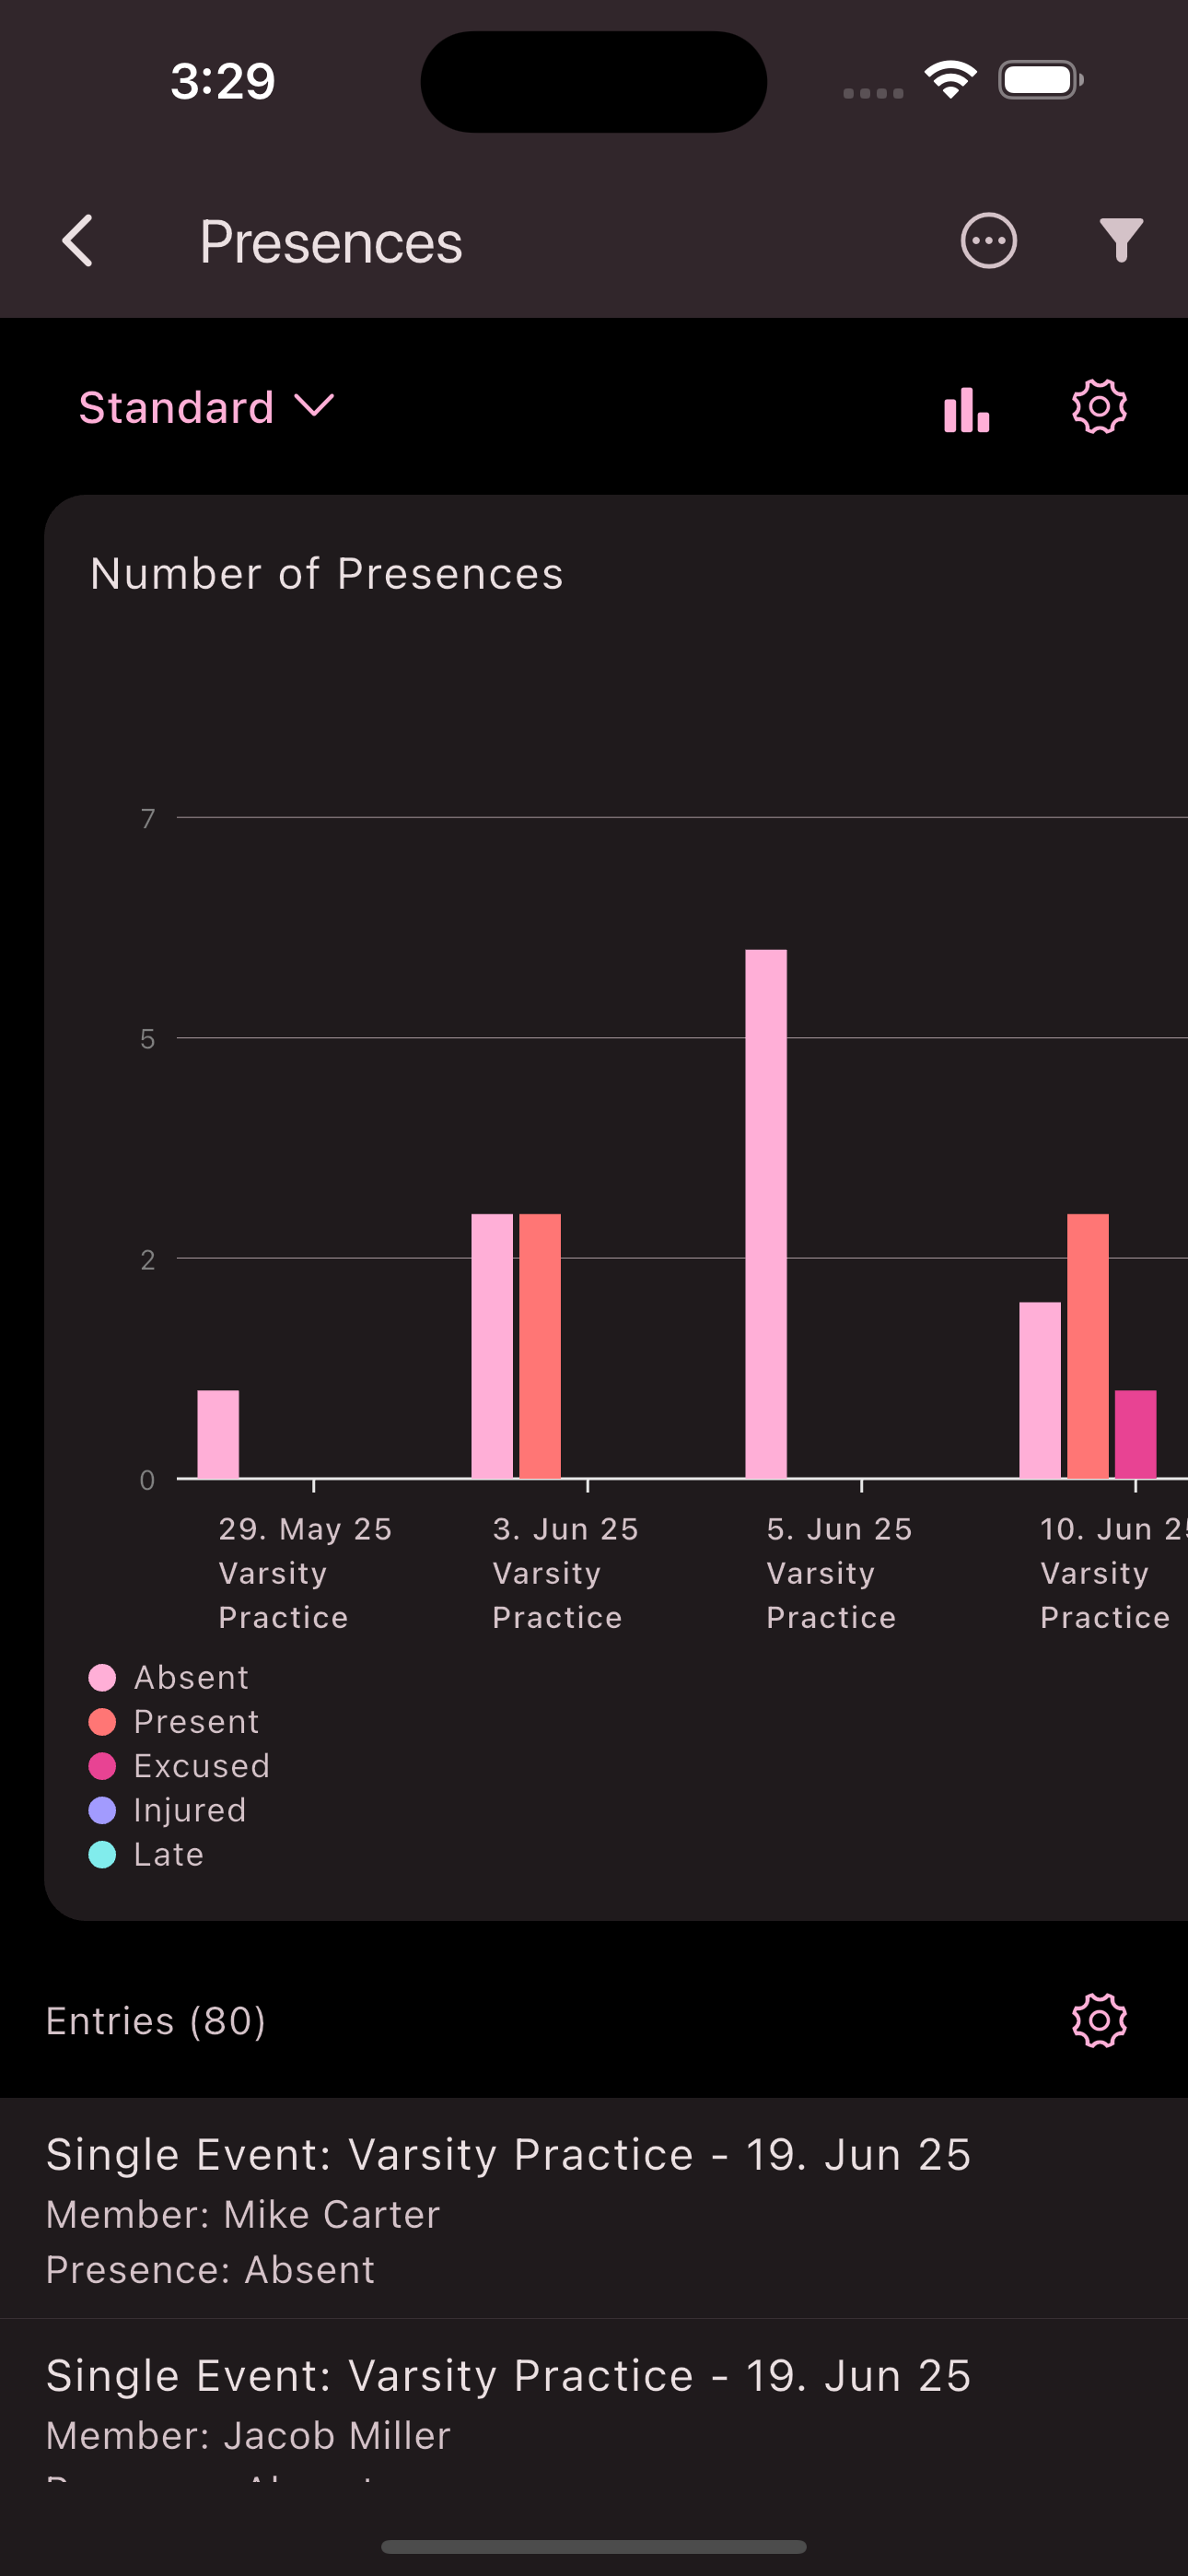
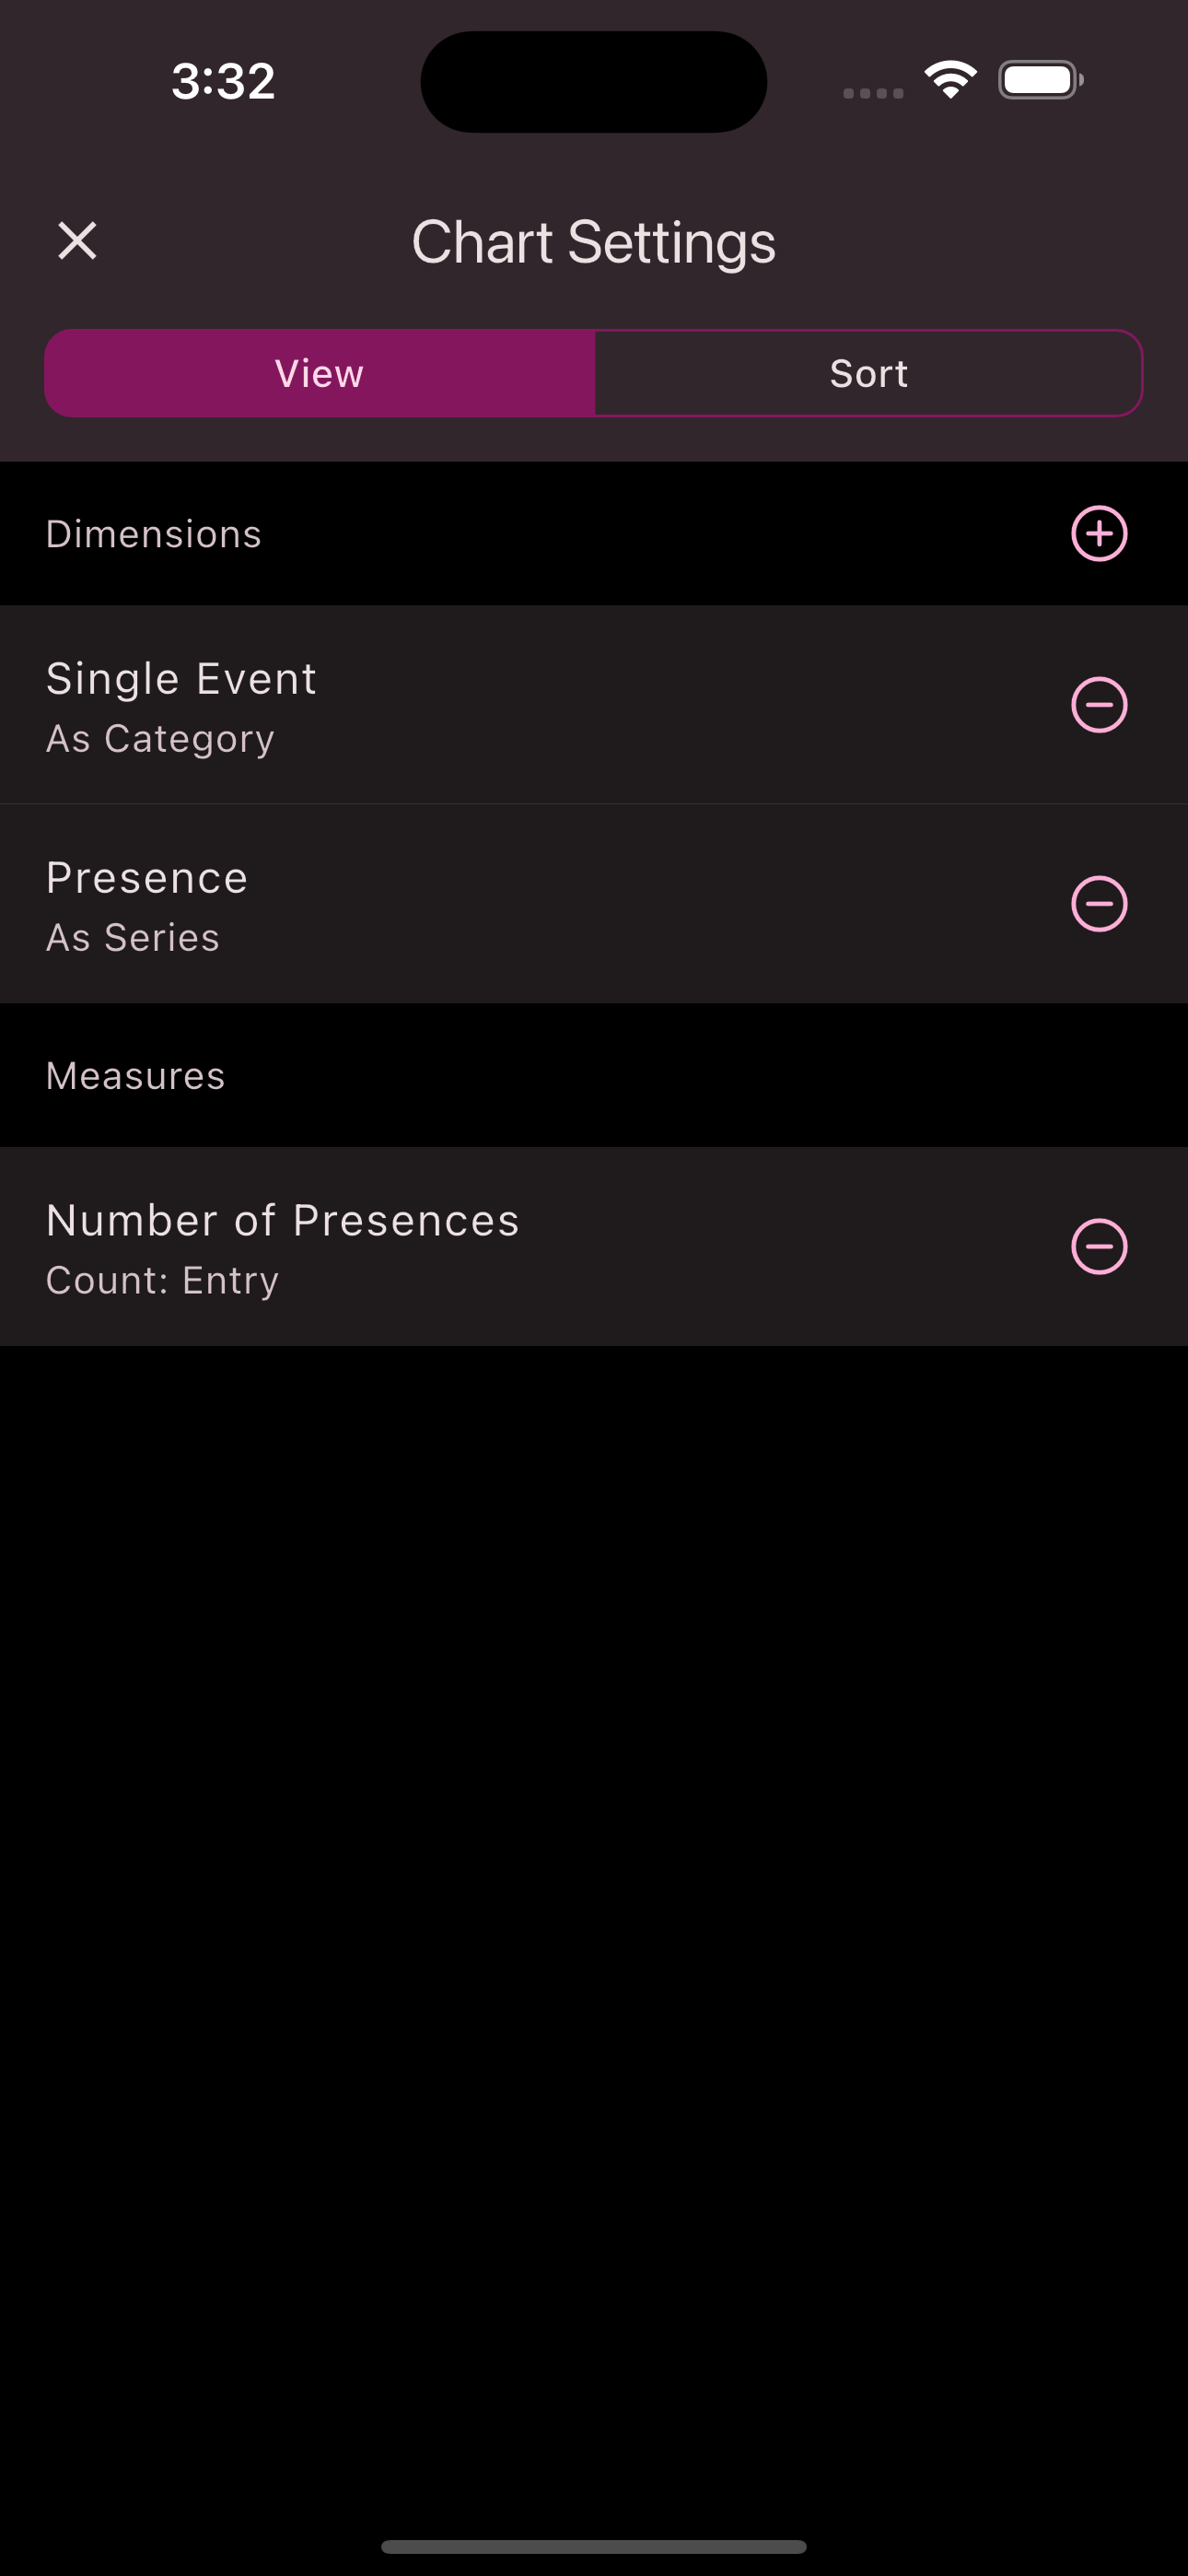
For this, we add a dimension that uses the Single Event
field. We select Category
as the type of dimension. Category type dimensions determine the fields that are displayed on the X-axis of the chart. Then we add another dimension that uses the Attendance
field. We set the type of this dimension to Series
. Series type dimensions determine subgroups of category type dimensions.
In summary, the whole thing looks like this: On the X-axis of our view, we have the individual events for which Attendance data was recorded. Each of these events on the X-axis gets the subgroups of Attendance values such as Present
or Absent
. This allows us to see the number of present or absent members per event.
What we have neglected so far is the Y-axis. This is determined by the measurement that we use. In the example of Attendance, we only have the measurement of the number of entries, which in this statistic corresponds to the number of Attendance entries. Other statistics can define several measurements, such as the average or minimum lap time in a running training.
Thus, the dimensions allow us to define the view of the data as we want it.
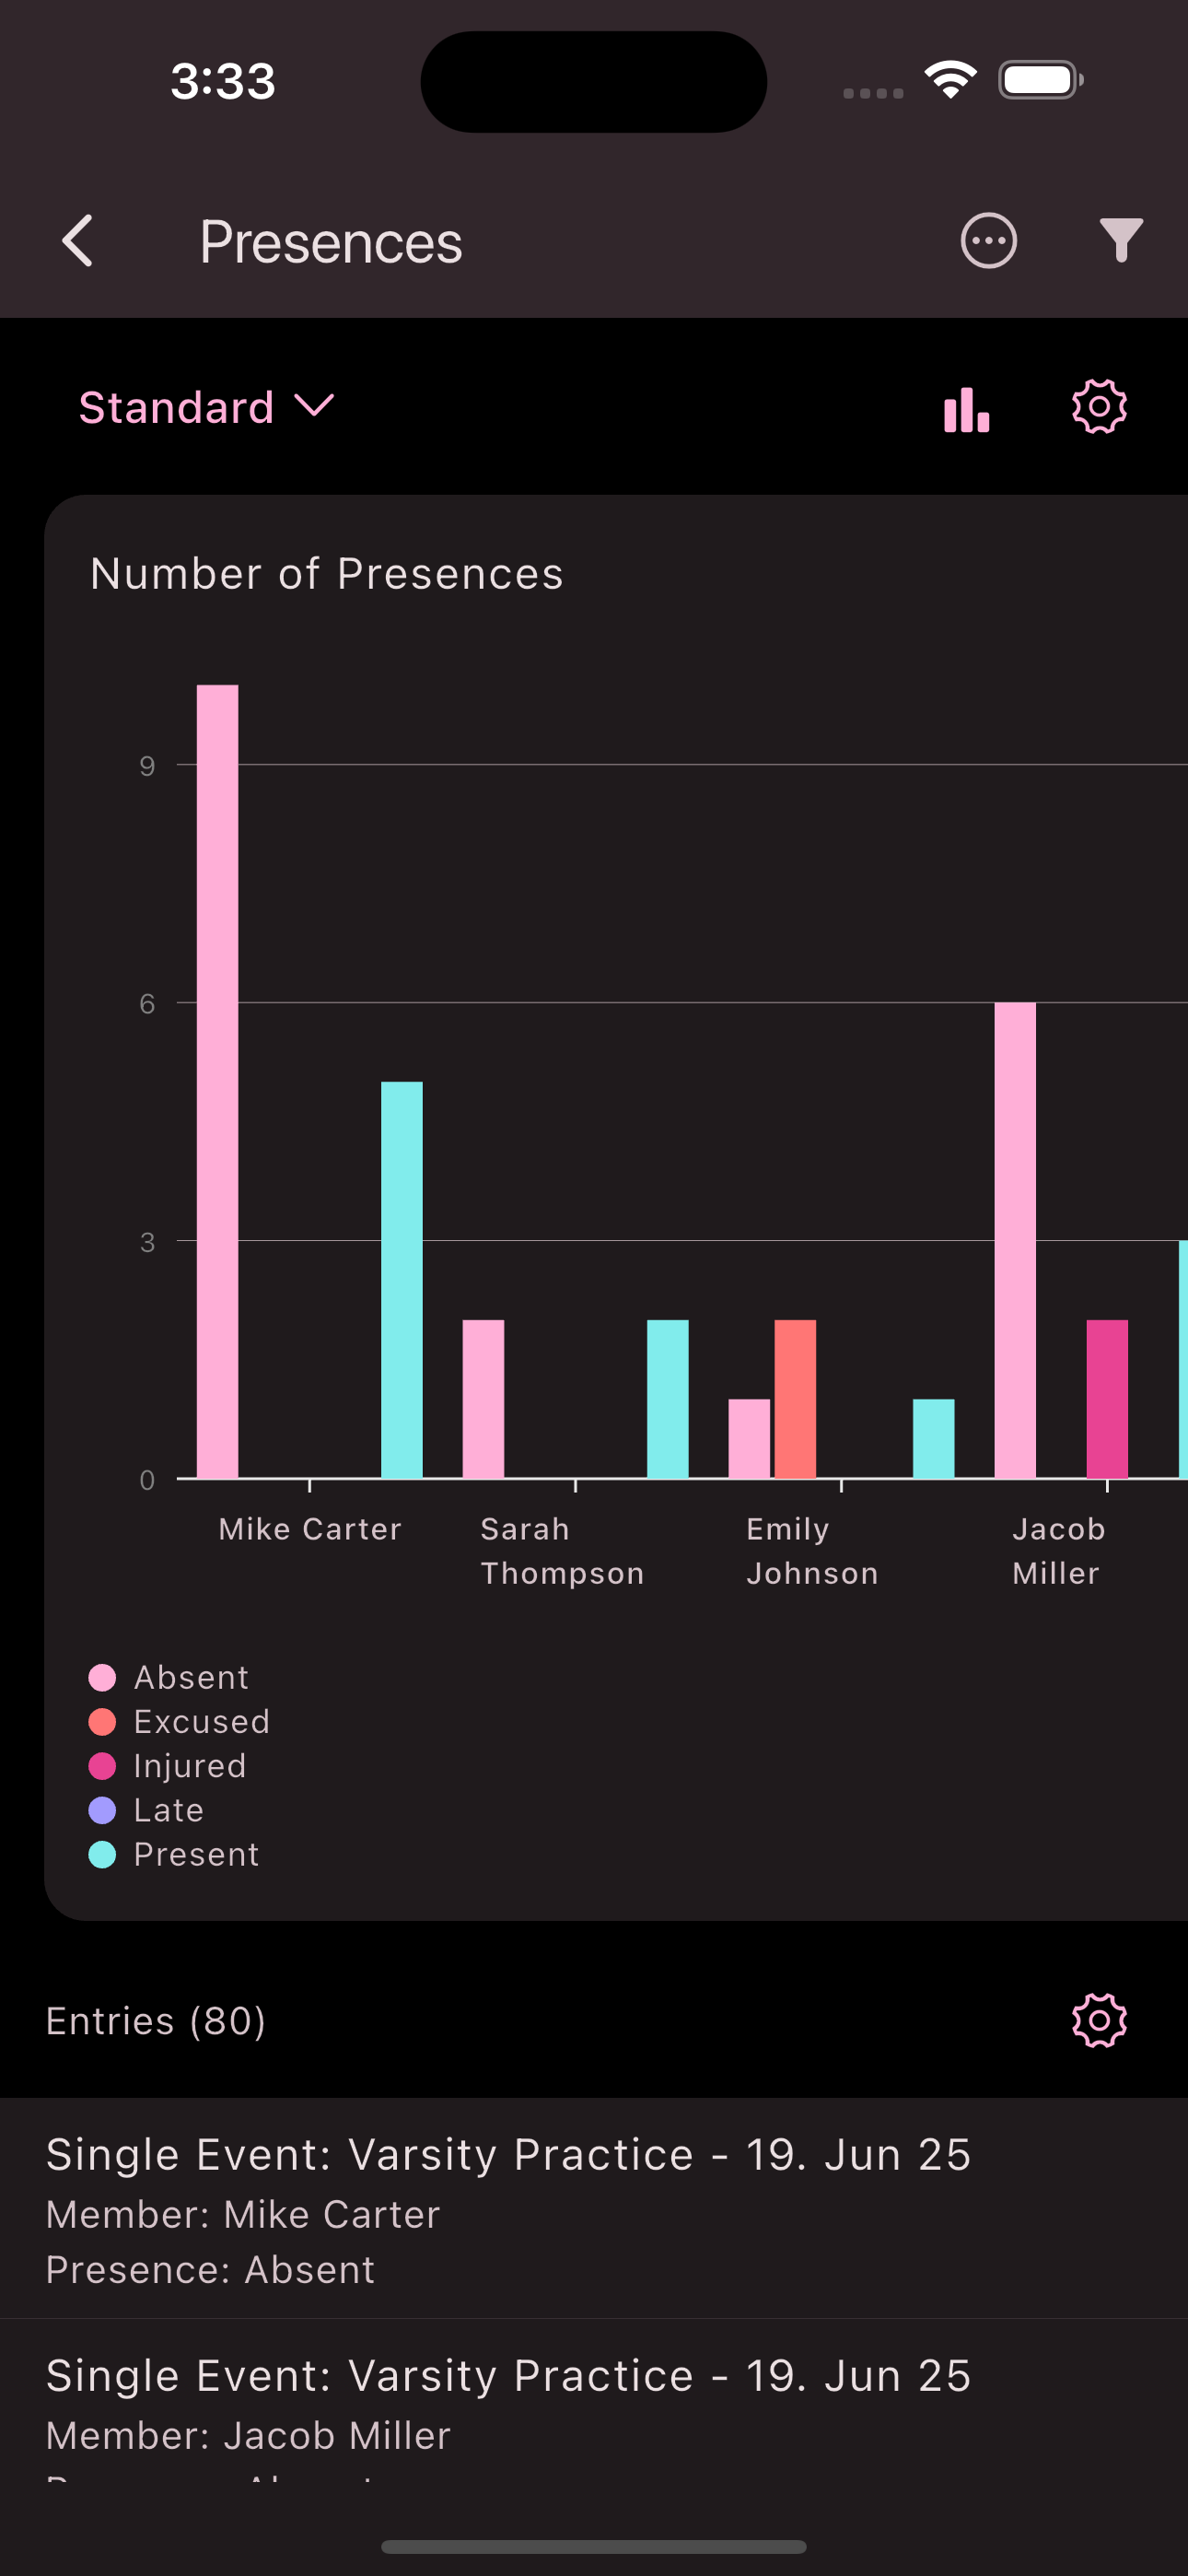
Here is another example. Suppose we only want to see the Attendance data per member. In this case, we replace the Single Event dimension with a dimension that defines the Member
field. We choose Category again as the type. The Series type dimension, which refers to the Attendance
field, forms the subgroups of Attendance data per member. 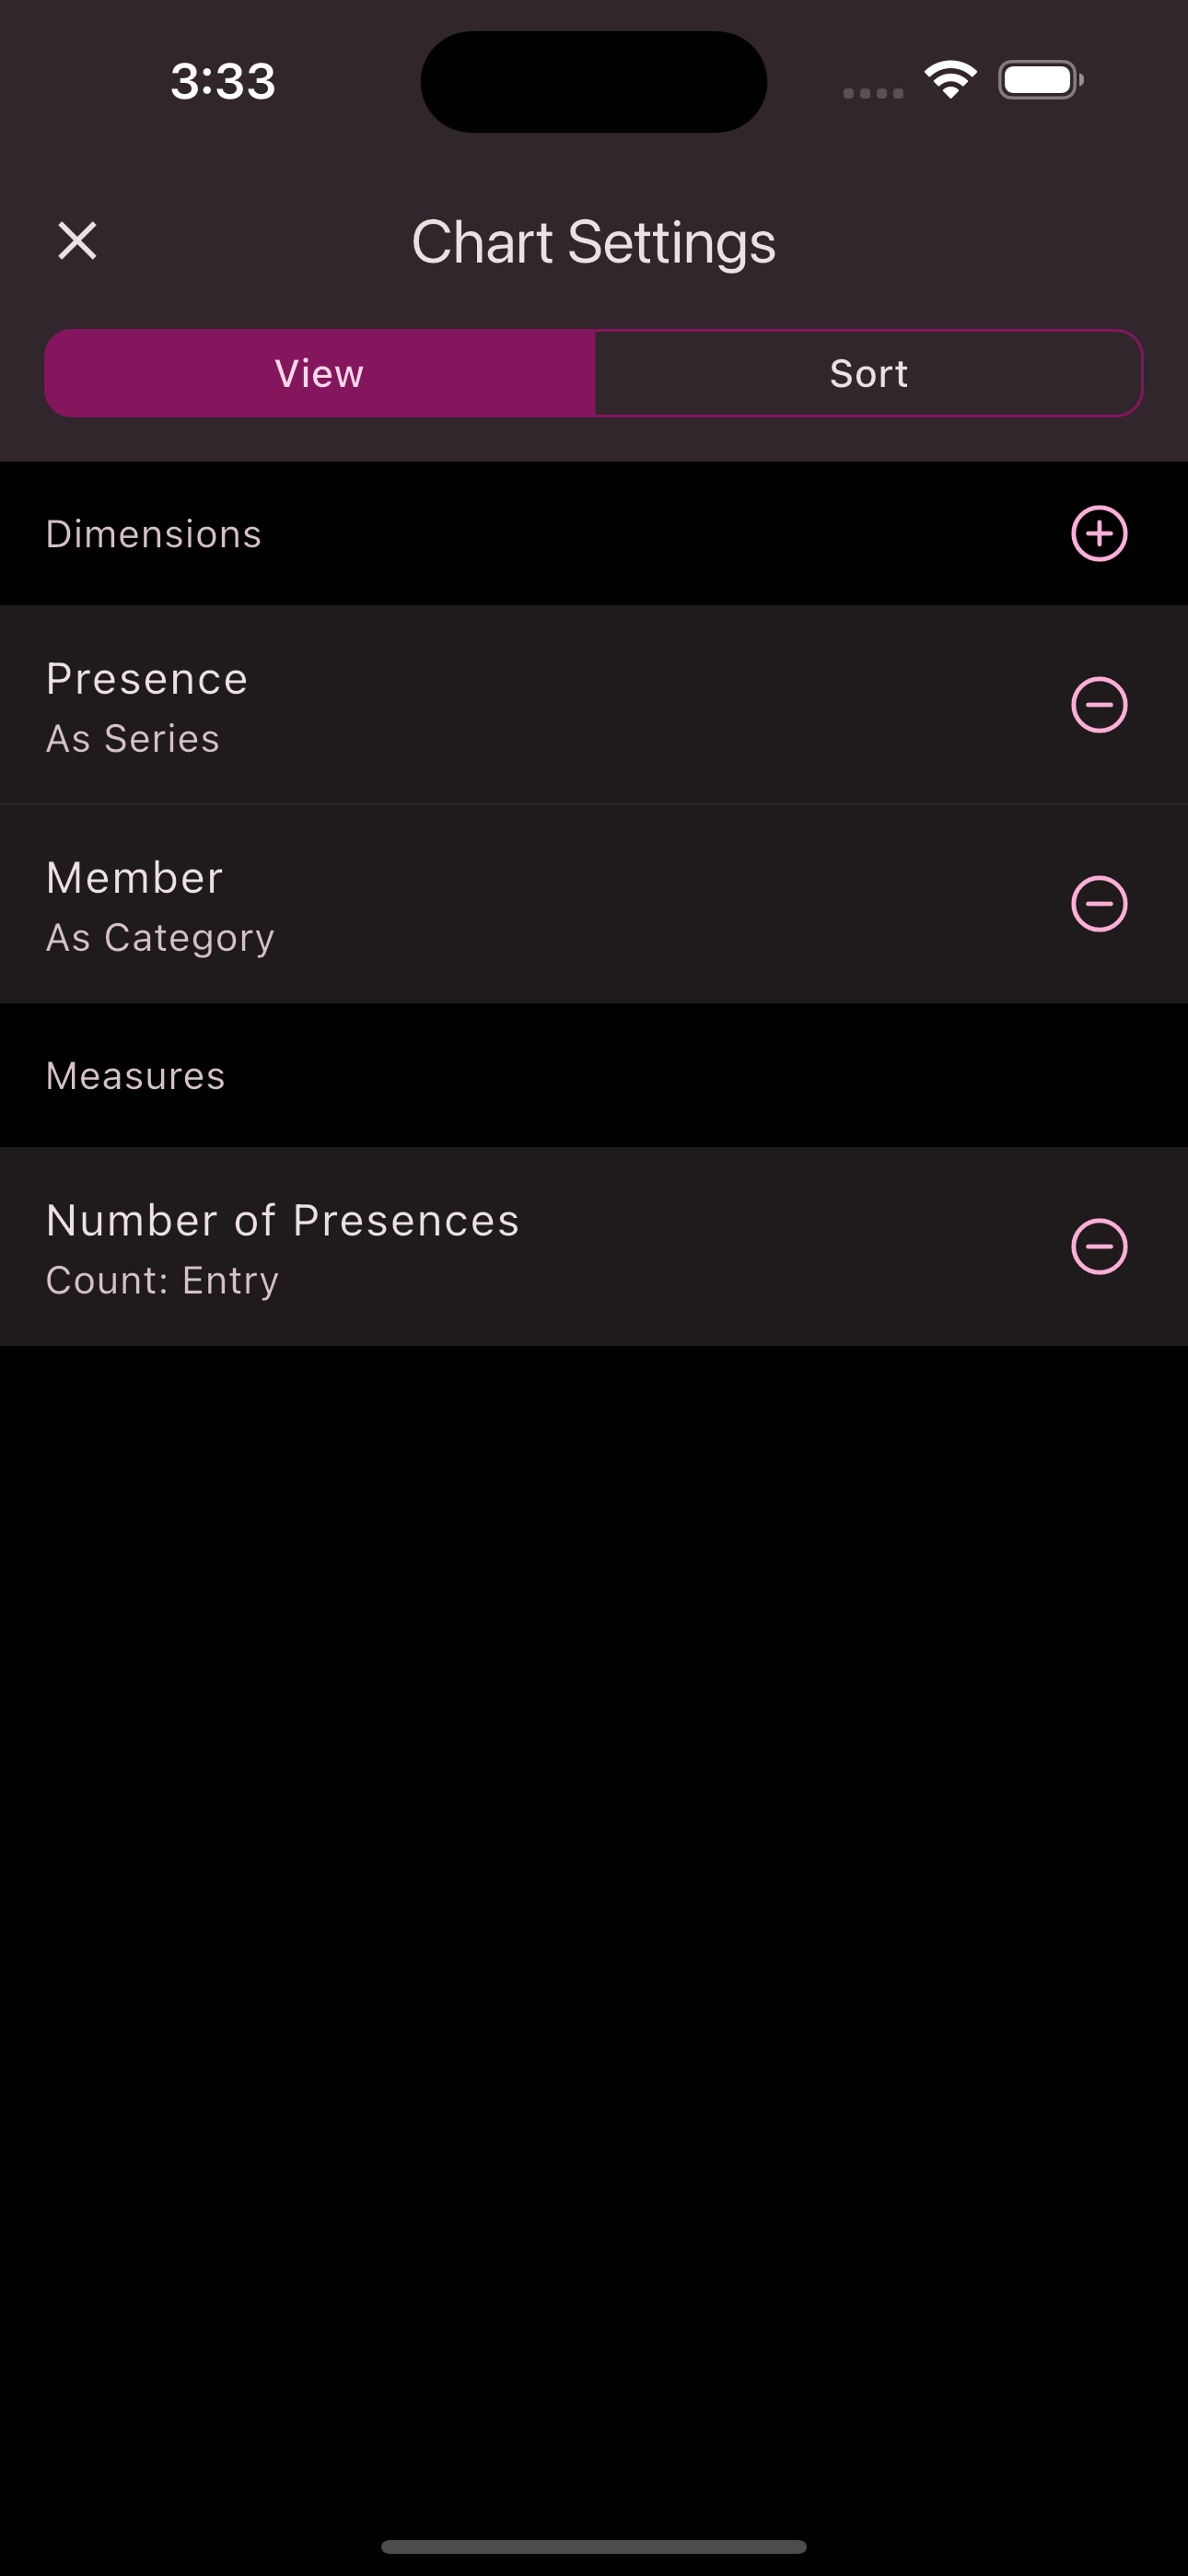
Filters and Sortings
In addition to the dimensions, filters and sortings can further refine the view of the data. While the dimensions determine how the data is displayed, the filters determine which data records should be included in this view. As an example, we can continue the scenario of the Attendace statistic. It is described there how to display the number of Attendance entries of the members. Suppose we are only interested in the Attendance entries that were recorded in this quarter. In this case, we can simply set a filter on the Single Event Start
field and define it with the value This Quarter
. And we only see the Attendance entries that were recorded in this quarter.

Filters can also be combined as required. For example, if we are only interested in the Attendance data of certain members, we can set a filter on the Member
field and select the members that should be included in the view.

The sortings can be used to further customize the view of the data. If we want to sort the view, for example, by the number of Attendance entries, we can achieve this with the sort function.
Views
Views allow you to save your current configuration, including dimensions, measurements, filters, and sortings. This has the advantage that you do not have to make your configuration every time to get a certain view of the data. When saving a view, you can also define it as the default view. This means that this view is automatically applied to all users when they view the statistic. However, users still have the option to use other settings by accessing other views or making manual changes. 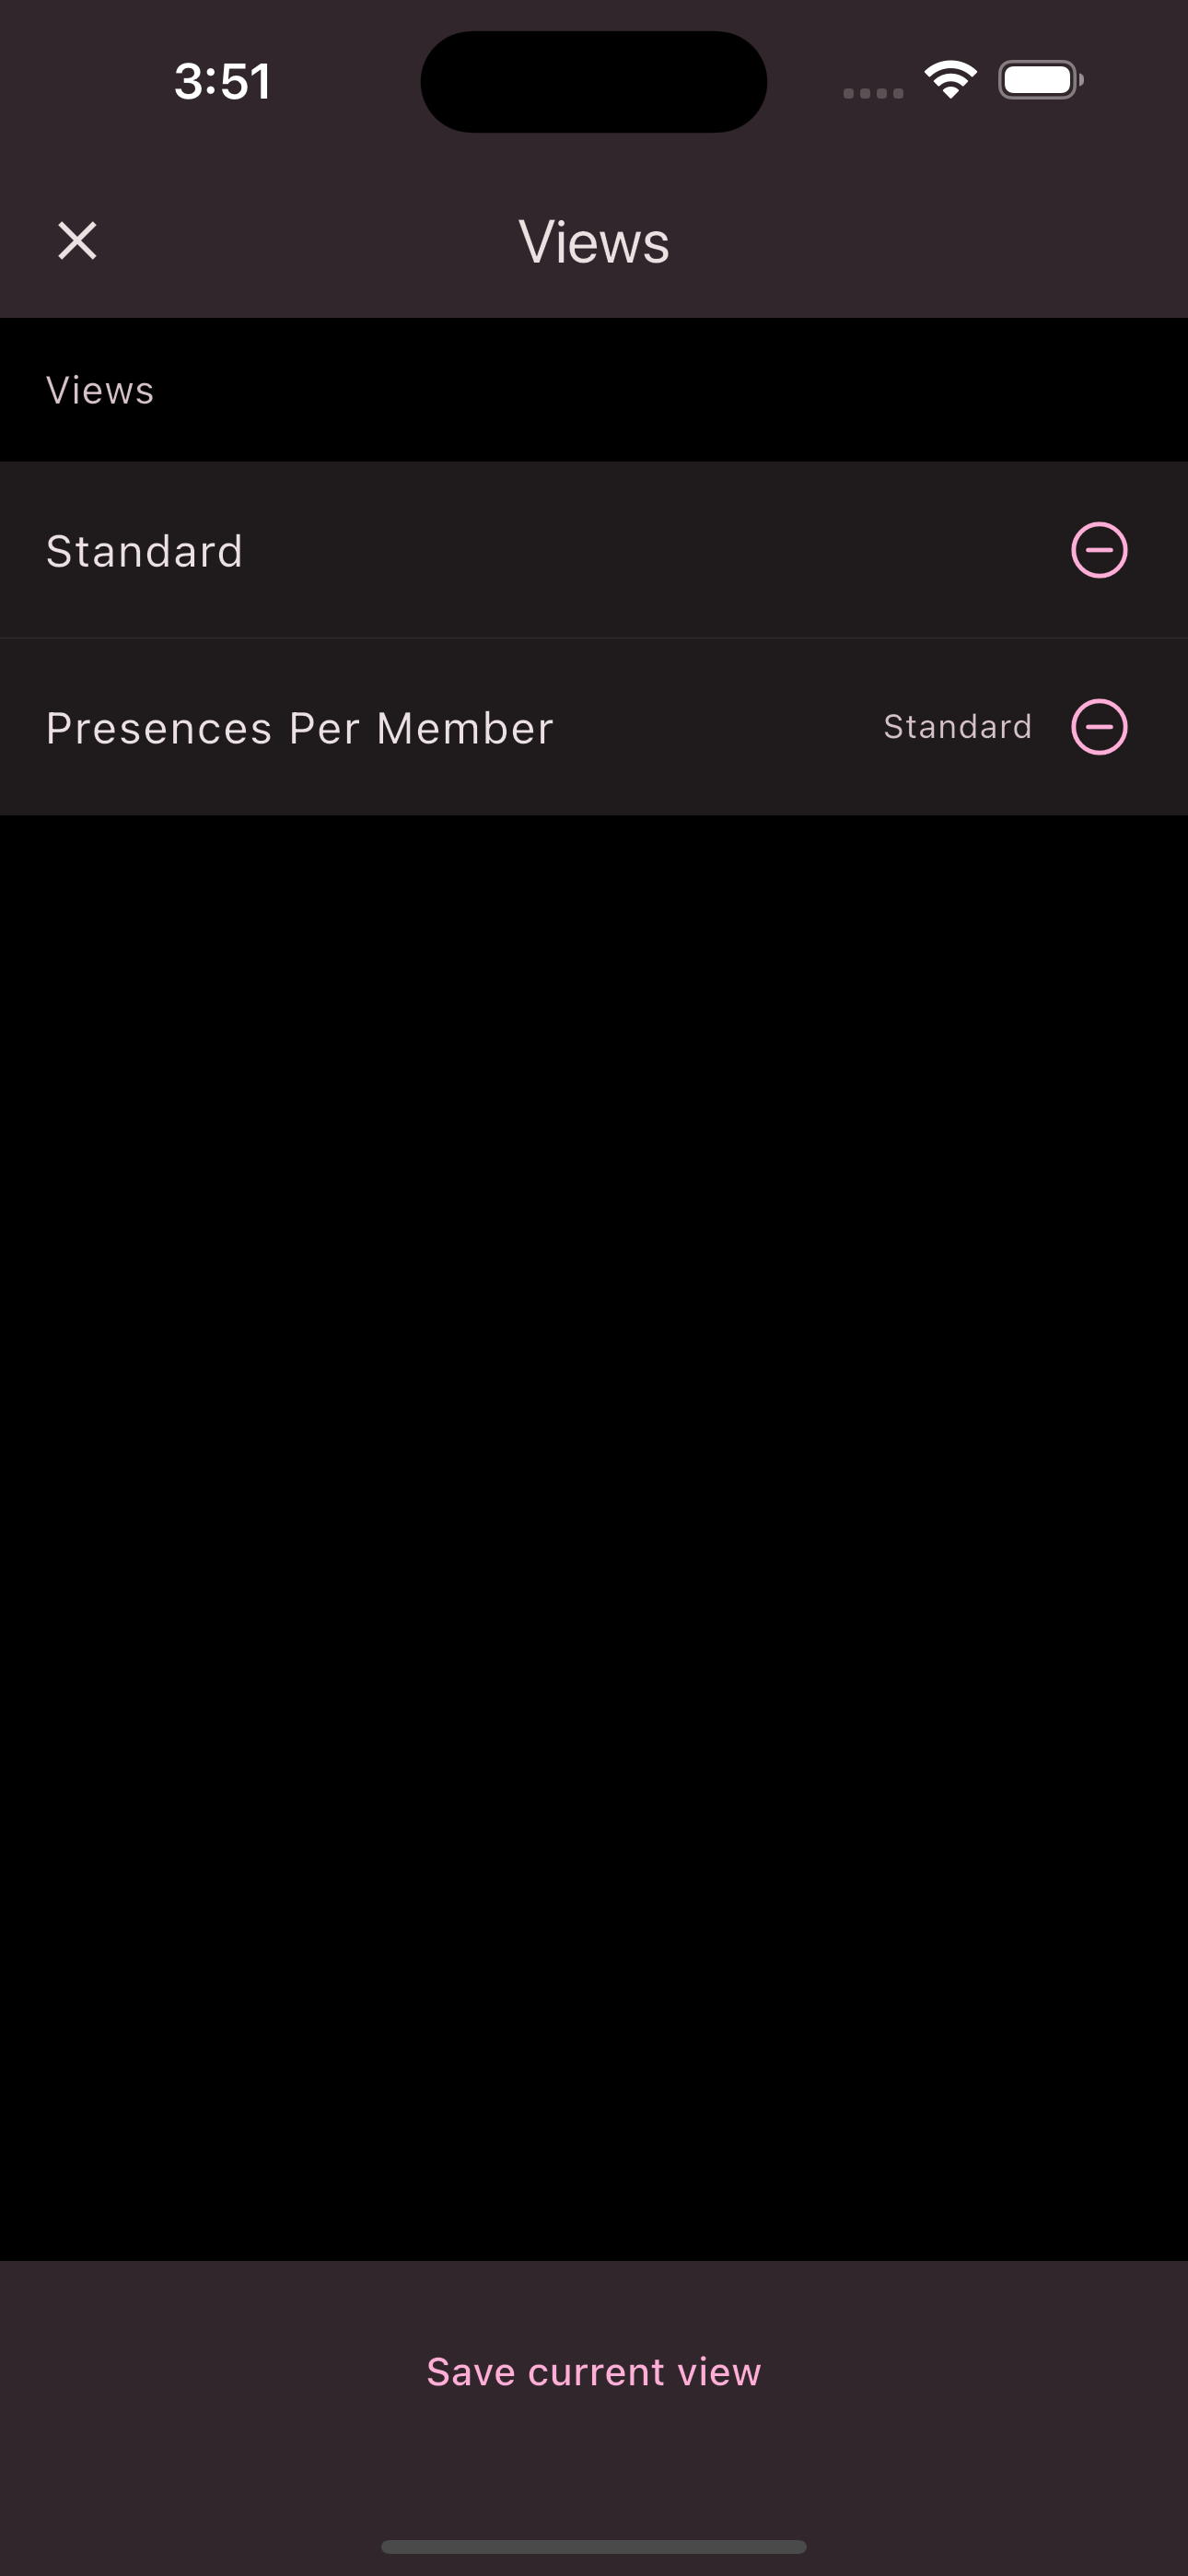
Is this page helpful?
What can we improve?
Thanks!
Is this page helpful?
What can we improve?
Thanks!